π
2010-02-14 01:01
in Computers, Linuxha, Solar
It's not quite a year yet, but I've recently worked on daily stats for our solar panels. If you go to the Solar and Power Monitoring post, you get all the stats that are gathered every few minutes.
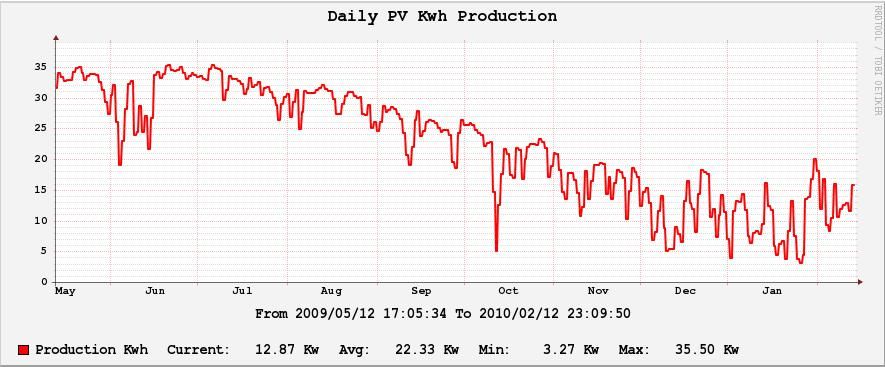
I was however missing daily stats showing for each day what time production started, what time it stopped (depending on dailight savings time of course), how many hours of sun we got. I also added a repeat of how many Kwh were produced that day.
Here are the resulting graphs (as a reminder you can zoom in by selecting a rectangle with the first mouse button and zoom out with the second button).
The good news from that data is that even the worst day, we made at least 3Kwh, which is what some small apartments use in a day. The average at the end of a year cycle should be around 24Kwh/day, which is 80% of what we end up using and less that what we'll end up paying once you figure out time of use offsets (i.e. the average electricity we make is worth more than the electricity we use).
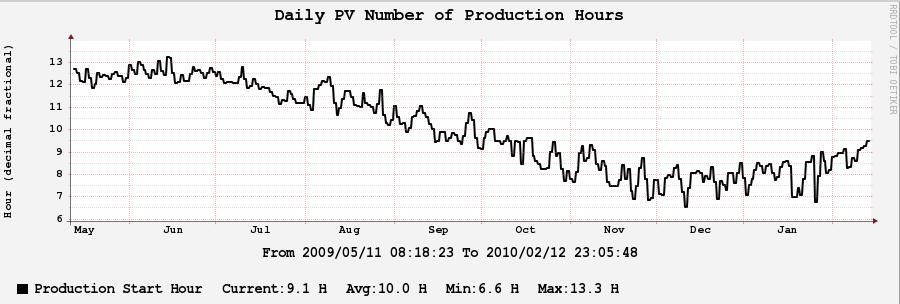
Below is a graph with production start and end (hour the sun starts hitting the panels and when it sets past the roof). Note the one hour jump on Nov 1st because of the daily savings change.

Production hours:
Production Kwh:
Last, but not least this page lets you get all the daily starts (note, you need to change the top preset to 3, 6, or 12 months to get useful data, last day doesn't show anything). |